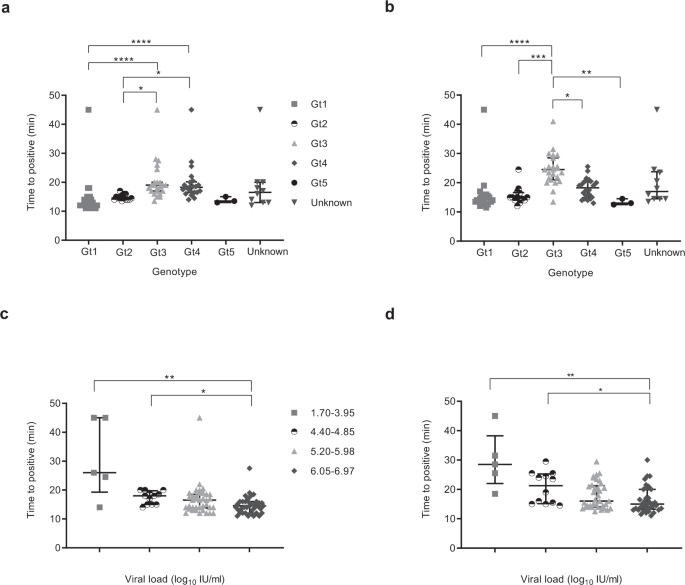
In order to evaluate the impact of genotype and viral load on the performance of both HCV RT-LAMP and LAMP assay, we defined samples as positive when the fluorescence signal was at least ten standard deviations above the mean baseline fluorescence of the positive control. The time to positive was then determined as described in Fig. S3. The majority of positive samples were detected within 30 min (Fig. 1a, b). For RT-LAMP, genotype 3 and 4 detection took longer than genotype 1 and 2. Similarly, for cDNA, genotype 3 positivity occurred later than all other genotypes. There was an inverse relationship between time to detection and viral load and significant differences occurred between the 1.70–3.95 log10 IU/mL group, 4.40–4.85 log10 IU/mL group and the 6.05–6.97 log10 IU/mL group for both RNA and cDNA (Fig. 1c, d).
The central lines indicate median with interquartile range as error bars, and each point on the graph represents the mean of a sample run in duplicate. False negative samples were recorded as time to positive reaction at 45 min. Statistical analysis was performed using a one-sided non-parametric Kruskal-Wallis with Dunn’s multiple comparisons test (one-sided). *p ≤ 0.05, **p ≤ 0.01, ***p ≤ 0.001, ****p ≤ 0.0001. a HCV RNA samples detection based on genotype (Gt): Gt1 (grey square, n = 26), Gt2 (white and black disc, n = 14), Gt3 (grey triangle, n = 23), Gt4 (grey lozenge, n = 22), Gt5 (black disc, n = 3), Unknown (grey inverse triangle, n = 10). Gt1 vs Gt3, p < 0.0001, Gt1 vs Gt4, p < 0.0001, Gt1 vs Unknown, p = 0.1524, Gt2 vs Gt3, p = 0.0101, Gt2 vs Gt4, p = 0.0284, Gt3 vs Gt5, p = 0.1846, Gt4 vs Gt5, p = 0.2814. All remaining groups had p values of >0.9999. b HCV cDNA samples detection based on genotype; Gt1 (grey square, n = 26), Gt2 (white and black disc, n = 14), Gt3 (grey triangle, n = 23), Gt4 (grey lozenge, n = 22), Gt5 (black disc, n = 3), Unknown (grey inverse triangle, n = 10). Gt1 vs Gt3, p < 0.0001, Gt1 vs Gt4, p = 0.0562, Gt1 vs Unknown, p = 0.3425, Gt2 vs Gt3, p = 0.0002, Gt3 vs Gt4, p = 0.0490, Gt3 vs Gt5, p = 0.0035, Gt3 vs Unknown, p = 0.3247, Gt4 vs Gt5, p = 0.3701, Gt5 vs Unknown, p = 0.5210. All the remaining groups had p values of >0.9999. c HCV RNA samples detection based on viral load: 1.7–3.95 (grey square, n = 5), 4.4–4.85 (black and white disc, n = 11), 5.2–5.98 (grey triangle, n = 34), 6.05–6.97 (grey lozenge, n = 44). 1.7–3.95 vs 5.2–5.98, p = 0.1937, 1.7–3.95 vs 6.05–6.97, p = 0.0095, 4.4–4.85 vs 6.05–6.97, p = 0.0301, 5.2–5.98 vs 6.05–6.97, p = 0.4768, 5.2–5.98 vs Unknown, p = 0.4506, 6.05–6.97 vs Unknown, p = 0.0118. All remaining groups had p values of >0.9999. d HCV cDNA samples detection based on viral load; 1.7–3.95 (grey square, n = 5), 4.4–4.85 (black and white disc, n = 11), 5.2–5.98 (grey triangle, n = 34), 6.05–6.97 (grey lozenge, n = 44). 1.7–3.95 vs 5.2–5.98, p = 0.0536, 1.7–3.95 vs 6.05–6.97, p = 0.0032, 1.7–3.95 vs Unknown, p = 0.5693, 4.4–4.85 vs 6.05–6.97, p = 0.0492, 5.2–5.98 vs 6.05–6.97, p = 0.9431, 6.05–6.97 vs Unknown, p = 0.7858. All remaining groups had p values of >0.9999. Source data are provided as a Source data file.

